subset methods for "GDALReadOnlyDataset"
GDALReadOnlyDataset-methods.Rdsubsets GDAL objects, returning a SpatialGridDataFrame object
Methods
- "["
signature(.Object = "GDALReadOnlyDataset"): requires package sp; selects rows and columns, and returns an object of class SpatialGridDataFrame if the grid is not rotated, or else of class SpatialPointsDataFrame. Any arguments passed to getRasterData (or in case of rotation getRasterTable) may be passed as named arguments; the first three unnamed arguments are row,col,band
Details
The [ method subsets a GDAL data set, returning a SpatialGridDataFrame object. Reading is
done on the GDAL side, and only the subset requested is ever read into memory.
Further named arguments to [ are to either getRasterTable or getRasterData:
- as.is
see getRasterData
- interleave
see getRasterData
- output.dim
see getRasterData
the other arguments, offset and region.dim are
derived from row/column selection values.
An GDALReadOnlyDataset object can be coerced directly to a SpatialGridDataFrame
See also
Examples
library(grid)
logo <- system.file("pictures/logo.jpg", package="rgdal")[1]
x <- new("GDALReadOnlyDataset", logo)
dim(x)
#> [1] 175 200
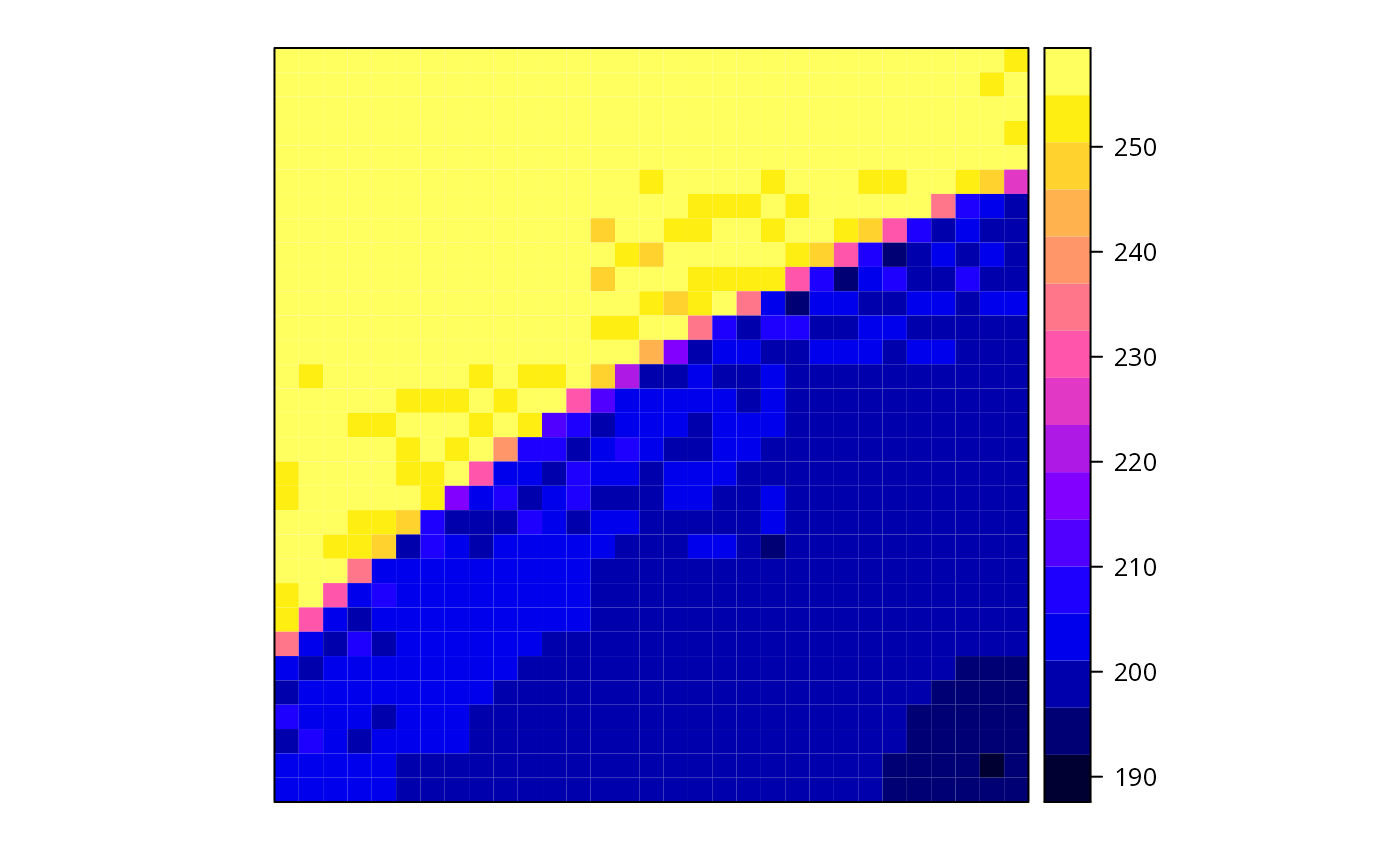
x.sp = x[20:50, 20:50]
#> Warning: GeoTransform values not available
#> Warning: GDAL support is provided by the sf and terra packages among others
class(x.sp)
#> [1] "SpatialGridDataFrame"
#> attr(,"package")
#> [1] "sp"
summary(x.sp)
#> Object of class SpatialGridDataFrame
#> Coordinates:
#> min max
#> x 19 50
#> y 125 156
#> Is projected: NA
#> proj4string : [NA]
#> Grid attributes:
#> cellcentre.offset cellsize cells.dim
#> x 19.5 1 31
#> y 125.5 1 31
#> Data attributes:
#> band1
#> Min. :192.0
#> 1st Qu.:200.0
#> Median :204.0
#> Mean :224.1
#> 3rd Qu.:255.0
#> Max. :255.0
spplot(x.sp)
 GDAL.close(x)
logo <- system.file("pictures/Rlogo.jpg", package="rgdal")[1]
x.gdal <- new("GDALReadOnlyDataset", logo)
x = x.gdal[,,3]
#> Warning: GeoTransform values not available
#> Warning: GDAL support is provided by the sf and terra packages among others
dim(x)
#> [1] 35000 1
summary(x)
#> Object of class SpatialGridDataFrame
#> Coordinates:
#> min max
#> x 0 200
#> y 0 175
#> Is projected: NA
#> proj4string : [NA]
#> Grid attributes:
#> cellcentre.offset cellsize cells.dim
#> x 0.5 1 200
#> y 0.5 1 175
#> Data attributes:
#> band1
#> Min. :127.0
#> 1st Qu.:188.0
#> Median :255.0
#> Mean :224.6
#> 3rd Qu.:255.0
#> Max. :255.0
spplot(x)
GDAL.close(x)
logo <- system.file("pictures/Rlogo.jpg", package="rgdal")[1]
x.gdal <- new("GDALReadOnlyDataset", logo)
x = x.gdal[,,3]
#> Warning: GeoTransform values not available
#> Warning: GDAL support is provided by the sf and terra packages among others
dim(x)
#> [1] 35000 1
summary(x)
#> Object of class SpatialGridDataFrame
#> Coordinates:
#> min max
#> x 0 200
#> y 0 175
#> Is projected: NA
#> proj4string : [NA]
#> Grid attributes:
#> cellcentre.offset cellsize cells.dim
#> x 0.5 1 200
#> y 0.5 1 175
#> Data attributes:
#> band1
#> Min. :127.0
#> 1st Qu.:188.0
#> Median :255.0
#> Mean :224.6
#> 3rd Qu.:255.0
#> Max. :255.0
spplot(x)
 spplot(x.gdal[])
#> Warning: GeoTransform values not available
#> Warning: GDAL support is provided by the sf and terra packages among others
spplot(x.gdal[])
#> Warning: GeoTransform values not available
#> Warning: GDAL support is provided by the sf and terra packages among others
 GDAL.close(x.gdal)
logo <- system.file("pictures/Rlogo.jpg", package="rgdal")[1]
x.gdal <- new("GDALReadOnlyDataset", logo)
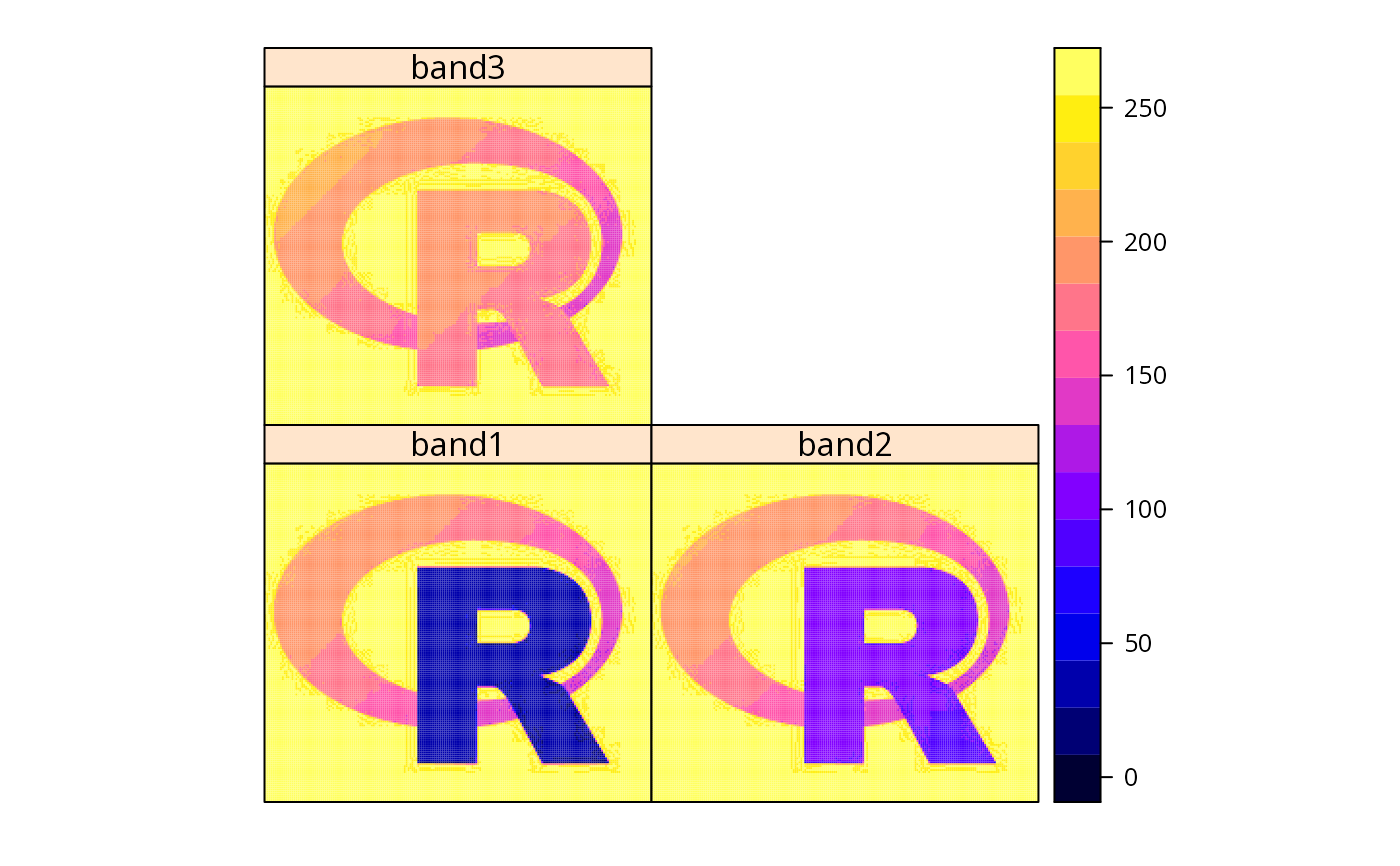
x.as <- as(x.gdal, "SpatialGridDataFrame")
#> Warning: GDAL support is provided by the sf and terra packages among others
#> Warning: GeoTransform values not available
GDAL.close(x.gdal)
summary(x.as)
#> Object of class SpatialGridDataFrame
#> Coordinates:
#> min max
#> x 0 200
#> y 0 175
#> Is projected: NA
#> proj4string : [NA]
#> Grid attributes:
#> cellcentre.offset cellsize cells.dim
#> x 0.5 1 200
#> y 0.5 1 175
#> Data attributes:
#> band1 band2 band3
#> Min. : 8.0 Min. : 75.0 Min. :127.0
#> 1st Qu.:162.0 1st Qu.:163.0 1st Qu.:188.0
#> Median :255.0 Median :255.0 Median :255.0
#> Mean :192.4 Mean :206.7 Mean :224.6
#> 3rd Qu.:255.0 3rd Qu.:255.0 3rd Qu.:255.0
#> Max. :255.0 Max. :255.0 Max. :255.0
GDAL.close(x.gdal)
logo <- system.file("pictures/Rlogo.jpg", package="rgdal")[1]
x.gdal <- new("GDALReadOnlyDataset", logo)
x.as <- as(x.gdal, "SpatialGridDataFrame")
#> Warning: GDAL support is provided by the sf and terra packages among others
#> Warning: GeoTransform values not available
GDAL.close(x.gdal)
summary(x.as)
#> Object of class SpatialGridDataFrame
#> Coordinates:
#> min max
#> x 0 200
#> y 0 175
#> Is projected: NA
#> proj4string : [NA]
#> Grid attributes:
#> cellcentre.offset cellsize cells.dim
#> x 0.5 1 200
#> y 0.5 1 175
#> Data attributes:
#> band1 band2 band3
#> Min. : 8.0 Min. : 75.0 Min. :127.0
#> 1st Qu.:162.0 1st Qu.:163.0 1st Qu.:188.0
#> Median :255.0 Median :255.0 Median :255.0
#> Mean :192.4 Mean :206.7 Mean :224.6
#> 3rd Qu.:255.0 3rd Qu.:255.0 3rd Qu.:255.0
#> Max. :255.0 Max. :255.0 Max. :255.0